Why Do Nebulae Look Blue?
Blue nebulae become easier to interpret when recorded wavelengths are separated from colors chosen for a finished display. The same blue appearance can result from scattered starlight, emission from ionized gas, or a mapping decision during image processing.
These routes involve different physics and should not be treated as interchangeable. Color becomes scientifically useful after the observing wavelength, filter set, and processing method are known.
Scattered Starlight Looks Blue
A reflection nebula becomes visible when dust redirects light from a nearby star toward the observer. Fine interstellar grains often scatter shorter visible wavelengths more efficiently than longer red wavelengths, giving the cloud a blue bias. The process does not require the cloud's gas to generate its own visible emission.
Instead, the recorded light carries the spectrum of the illuminating star after dust has scattered and absorbed part of it.
The resulting shade depends on more than dust alone. Grain size, composition, viewing angle, cloud thickness, and the star's spectrum can change the balance of wavelengths that reach a telescope. Dense areas may absorb enough background light to appear dark beside the illuminated material, while thinner regions remain bright.
The star's location relative to the dust can also concentrate scattered light on one side of the cloud. A blue reflection cloud therefore indicates a light-scattering geometry, but it does not provide a complete chemical inventory.
Ionized Gas Can Glow
An emission nebula produces light when energetic radiation ionizes gas and the disturbed atoms or ions release energy at specific wavelengths. Doubly ionized oxygen has prominent visible emission lines near 496 and 501 nanometers, within the blue-green region of the spectrum.
These lines can contribute strongly to a nebula's recorded brightness. Depending on the filter combination and display mapping, oxygen emission may appear green, cyan, or blue in a published composite.
Line strength is not a direct measurement of how much oxygen the cloud contains. Temperature, gas density, ionization state, and the energy of the nearby radiation field all affect the signal. Other light can occupy a similar displayed range, including hydrogen emission near 486 nanometers and reflected starlight spread across many wavelengths. A blue area may consequently contain several signals that a broad visual channel has combined.
Filters Build the Composite
Many scientific telescope cameras record a monochrome exposure through one filter at a time. A broad filter collects a range of wavelengths, while a narrow filter can isolate a small interval around a chosen emission line. Image processors align several exposures and assign them to red, green, and blue display channels.
Longer exposures can make a faint channel compete visually with an intrinsically brighter one. When broad visible filters closely match those channels, the composite can approximate how the wavelength differences relate to ordinary vision, although detector sensitivity and exposure scaling still matter.
Representative-color images follow another purpose. They may translate infrared or ultraviolet measurements into visible screen colors, or give separate emission-line exposures clearly different hues so their structures remain distinguishable. A common method assigns the shortest observed wavelength to blue and the longest to red, yet this ordering is not required for every release.
The same oxygen-line filter can be blue in one composite and green in another, which shows why displayed blue is sometimes a data label rather than a direct visible hue.
Check the Color Context
The first useful check is the image's filter key or color legend. A smooth blue cloud around an illuminating star, recorded through broad visible filters, is consistent with dust-scattered starlight. Blue confined to rims, knots, or cavities in a narrowband composite may instead represent a selected emission line. Shape supports an interpretation, but it cannot establish the responsible process without wavelength information.
Spectroscopy provides a stronger test because it separates light by wavelength and identifies individual emission lines. Comparing visible observations with infrared data can also show where dust absorbs starlight and reradiates energy outside human vision. Contrast stretching, channel balance, saturation, and background adjustment help reveal faint structures, but they can change which hue appears most prominent on a screen. Naming an element from blue alone is therefore a common interpretation error.
Blue in a nebula can describe real visible scattering, a selected emission line, or a display channel assigned during processing. Reading the filter key and considering the cloud's structure provides a sounder interpretation than naming an element from hue alone.
-
 Conscious Mind FactsHow does consciousness work? Science offers fascinating clues about awareness, attention, and thought!
 -
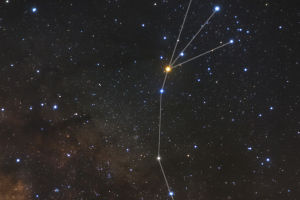 Spot Scorpius At NightStop Getting Lost in the Stars! This One Red Gem Is the Secret to Unlocking the Night Sky's Most Terrifying Shape!
 -
 Humanoid Robot FutureWhy Are Humanoid Robots Being Developed? Their Practical Uses, Limits, and Impact on Future Work Explained!
Contact to : xyjph123@gmail.com
Privacy Agreement
Copyright © boyuanhulian 2020 - 2022. All Right Reserved.
Privacy Agreement
Copyright © boyuanhulian 2020 - 2022. All Right Reserved.